Background
Despite the social construct of race lacking biological significance, it plays a significant role in health disparities and necessitates examination to address social stratification and health inequities. Not reporting race in medical research neglects the reality of social stratification, injustices, and implications for population health.1–3 Additionally, excluding racial demographic data from research publications may conceal health disparities.4 This study focuses on Triple Negative Breast Cancer (TNBC) clinical trials, aiming to meta-analyze the inclusion of racial data and assess racial representation.
Methods
A meta-analysis of 81 completed TNBC trials (2011-2023) from ClinicalTrials.gov was conducted. Demographic data on race and sex were extracted and analyzed using Microsoft Excel. Two independent reviewers extracted study-level data for a random-effects analysis. The primary outcome was identifying the prevalence of studies lacking racial data. The secondary outcomes are the prevalence of each racial category (White, Black, Asian, Hispanic/Latino, and Combined Other) among all TNBC clinical trials that reported demographic information. The Combined Other category includes American Indian, Native Hawaiian, more than one race, and unknown/unreported.
Results
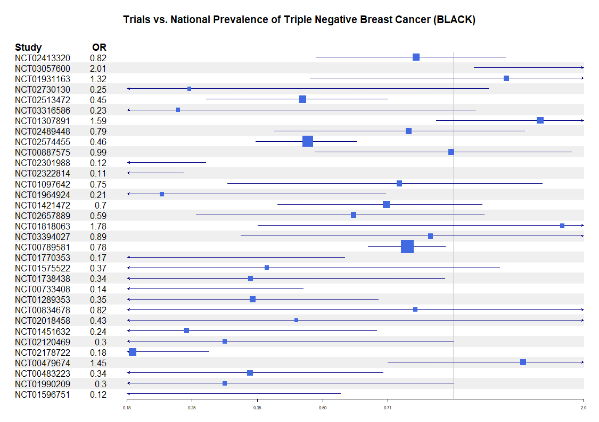
Of 81 trials, 29.63% did not report racial data. The remaining 57 trials (8,196 participants) revealed 73.98% White, 10.29% Asian, 7.85% Black, 8.02% Hispanic/Latino, and 4.12% “combined other” participants. U.S.-based trials (36 studies, 3,348 participants) showed 77.96% White, 12.03% Black, 4.51% Asian, and 4.96% Hispanic/Latino participants. Moreover, we conducted a comparative analysis between the racial distribution in U.S. clinical trials and the prevalence of TNBC in the U.S. population, utilizing the National Cancer Institute’s Surveillance, Epidemiology, and End Results (SEER) Public Use Datasets (2010-2019). The analysis revealed a significant discrepancy with White (p<.001) participants being overrepresented, and Black (p<.001), Asian (p<.001), Hispanic/Latino (p<.001), American Indian (p<.001), more than one race (p<.02), and Other/Unknown (p<.001) populations being underrepresented.
Conclusions
Globally, 29.63% of TNBC trials did not report racial data, raising concerns about generalizability. U.S.-based studies exhibited overrepresentation of White participants and underrepresentation of Black, Asian, Hispanic/Latino, American Indian, Native Hawaiian, and other categories. Notably, Black and Hispanic/Latino individuals, comprising a substantial portion of TNBC patients, were underrepresented. These findings underscore racial/ethnic disparities in breast cancer trial participation, warranting further investigation into recruitment barriers for equitable participation.
Limitations
The National Cancer Institute’s Surveillance, Epidemiology, and End Results (SEER) Public Use Datasets released in November 2021 were used for this study. Both breast cancer cases (numerator) and population (denominator) from SEER areas from 2010 to 2019 are available for cancer incidence calculation [26]. The year 2010 is the earliest year for triple-negative breast cancer data available in SEER and the year 2019 is the latest dataset. The SEER program supports 18 population-based tumor registries in 9 areas (San Francisco/Oakland, San Jose-Monterey, Los Angeles, Greater California, Detroit, Seattle, Atlanta, Rural Georgia, and Greater Georgia) and nine states (Alaska, Connecticut, Iowa, New Mexico, Utah, Hawaii, Louisiana, Kentucky, and New Jersey), accounting for 28% of the U.S. population. The SEER registries ascertain all newly diagnosed (incident) cancer cases from multiple reporting sources.
